Ohio 2004 Presidential Elections:
Results, Summary, Charts and Spreadsheets
© James Q. Jacobs. All Rights Reserved.
Scroll Down for the Charts and Results Summary
- Ohio 2004 Presidential Election Canvass - Voting by Counties - 861 Kb Excel file. Updated.
- Ohio 2004 Presidential Election Statistical Summary - 67 Kb Excel file.
- Ohio Precinct Changes: 1996 - 2004 - 53 Kb Excel file.
Return to: How Kerry Votes were Switched to Bush Votes
Cuyahoga County Precinct Level Analysis NEW
Access Database: Cuyahoga
Results with Probability Sorts NEW July
2006: Updated Spreadsheets with Probability Sorting:
NEW Jan.
22, 2007: Extended Analysis of Probability Subsets
NEW
2008: cuyahoga_probability_data.xls -
K-B Probability Subsets - 0.7 Mb cuyahoga_probability_data.xls -
Probability Subsets - 0.7 Mb
The spreadsheets are part of my Cuyahoga County analysis and the data organization is explained therein. Read the article to understand the symbols used in the spreadsheets and charts. The updated spreadsheets represent a new stage in the study; I restarted the analysis with probability sorting added. Missing data was found and inserted, and slight errors were corrected. Cross-vote probabilities for precincts and for locations were added, subset sorts were added, precincts and locations were resorted, probability sorts were analyzed and compared, and statistical summaries were added. Some significant statistical anomalies are highlighted. Charts of new results are incorporated into these pages.
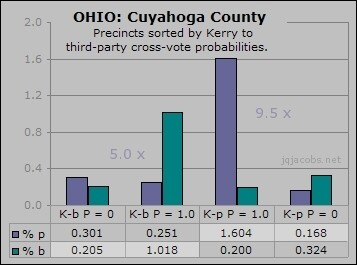
The workbooks are ready for use in statistical programs and projects. I consider them reliable and they supersede my previous Cuyahoga County results files. Let me know if you detect any problem whatsoever. Joe Knapp did the initial heavy lifting, and gets loud applause for building, from the official County election text files, the original spreadsheet I used. I manipulated the data many times, and any errors are mine. Amidst the millions of numbers and digits, I hope there are no errors. I need to know if you find anything, no matter how slight. Additional subset probability sorts by minor candidate probabilities have been added. This feature in cuyahoga_2.xls produced significant findings regarding intended third-party voting, and can serve as a model for other researh questions. In particular, note the changes in percentage of votes to minor party candidates when there is a 1.0 probability that switched Kerry votes will be counted for either minor candidate. In the worksheet "2_2_Locations" in cuyahoga_2.xls, compare the 1.0 probability percentages with the 0.0 probability precincts. At these 2 ballot order and 2 precinct locations, Peroutka received 1.932% of the vote in precincts where switched Kerry votes count for Peroutka, compared with 0.142% in precincts where switched Kerry votes count as Bush votes. In Jan. 2007, I uploaded an extended analysis spreadsheet, cuyahoga_precinct_subsets.xls with the same comparison for other subset, plus numerous charts.
Again, to understand the spreadsheet notation, read "How Kerry Votes were Switched to Bush Votes." To view some of the latest statistical results, check the highlighting in the spreadsheet summaries. One reason the spreadsheet are released is so others can study the data without having to also do the tedious and time-consuming probability sorts. They are also a data foundation from which many questions, in addition to those herein, can be addressed. |

Scroll down for tables, charts, and graphs.
Back to the Main Spreadsheets Page
The following table and chart display the state results sorted by county voting methods.
Some of my state-wide analysis preceded release of the official results.
Official Results are in the spreadsheets.
| 2004 Ohio Election Results
Summary |
||||
| State |
E-Vote |
Op-Scan |
Punch Card |
|
| Population |
11,435,798 |
1,799,299 |
1,382,208 |
8,254,291 |
| # Voters |
7,979,639 |
1,344,131 |
925,806 |
5,709,702 |
| # Votes |
5,574,476 |
870,237 |
670,058 |
4,034,181 |
| % Votes |
15.61 |
12.02 |
72.37 |
|
| % Cast |
69.86 |
64.74 |
72.38 |
70.65 |
| # Provisional |
155,428 |
21,590 |
17,078 |
116,760 |
| % Provisional |
2.79 |
2.48 |
2.55 |
2.89 |
| Kerry |
2,659,664 |
451,975 |
293,998 |
1,913,691 |
| Bush |
2,796,147 |
406,697 |
363,895 |
2,025,555 |
| Badnarik |
14,331 |
2,967 |
1,177 |
10,187 |
| Peroutka |
11,614 |
1,986 |
990 |
8,638 |
| Non-Votes |
92,720 |
6,612 |
9,998 |
76,110 |
| % Kerry |
47.711 |
51.937 |
43.877 |
47.437 |
| % Bush |
50.160 |
46.734 |
54.308 |
50.210 |
| % Badnarik |
0.257 |
0.341 |
0.176 |
0.253 |
| % Peroutka |
0.208 |
0.228 |
0.148 |
0.214 |
| % Non-Votes |
1.663 |
0.760 |
1.492 |
1.887 |
| Counties |
88 |
7 |
13 |
68 |
| Mean Bush Shift |
0.903 |
0.615 |
0.536 |
1.003 |


