Scroll down or click for
Ohio | Florida | California | Nevada | Iowa | South Dakota | New Mexico | Wisconsin
2004 Presidential Election Results - Excel files: 2004
Presidential Election Results, the Exit
Polls vs. the Vote Counts Comparison: 2000 and 2004 Presidential Election Results Percentages of 2004 USA Population Served by Voting Machine Types |

|
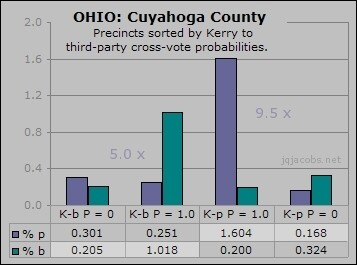
How Kerry Votes Were Switched to Bush Votes Excerpts: "Seven-eights of voters in heavily-Democratic Cuyahoga
County, more than one of every eight "... I focus on one Presidential election issue, cross-voting—how votes cast one way are counted as a vote for a different candidate or option. I also focus on Ohio and a particular area with one-tenth of the Ohio vote, Cuyahoga County. ... This article discusses problems with the 2004 Ohio Presidential election generally and demonstrates how the Cuyahoga County election was inherently unfair and resulted in many Kerry votes going uncounted, counted as third-party votes, or being switched to Bush votes...." "In a sample of 166,953 votes, one of every 34 Ohio voters,the Kerry-Bush margin shifts 6.15% ..." Continue reading: How Kerry Votes Were witched to Bush Votes (updated April 2008) |
The
charts displayed below are samples from the spreadsheets.
![]()
Ohio
ARTICLE: How Ohio Kerry Votes Were Switched to Bush Votes
|

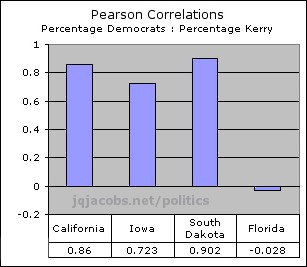
Only in Florida does % Kerry fail to correlate with % Democrats. Why?

In Florida, electronic voting correlations do not
match other voting methods.


In Florida, the 2004 Bush increase correlates with the percentage of
Democrats, moreso in
E-Touch counties than in Op-Scan counties. In Op-Scan counties, the
2004 Bush increase
negatively correlates to the percentage of registered Republicans. At
the same time, Bush Increase
has no correlation with Bush votes in E-Touch counties and a strong
correlation in Op-Scan counties.
Top
- California 2004 Presidential Election Canvass - Voting by County
- Nevada 2004 Presidential Election Canvass - Voting by County
- Official Iowa 2004 Election Canvass
- Iowa 2004 Presidential and Senate Canvass - Voting by Counties
- South Dakota Presidential and Senate Canvass - Voting by Counties
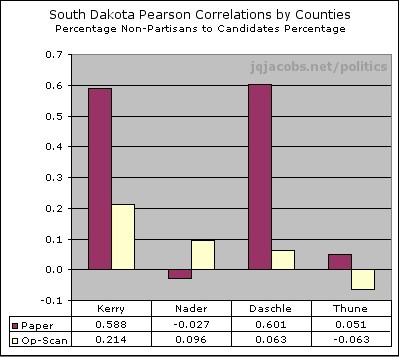
In South Dakota, the percentage of non-partisan voters has a strong
correlation
with the percentage of Daschle votes only in the counties with paper
ballots.
The Kerry and Daschle correlations match in paper ballot counties.
|
New Mexico
United Voters of New Mexico - Statistical Analysis of Voting Results |

![]()
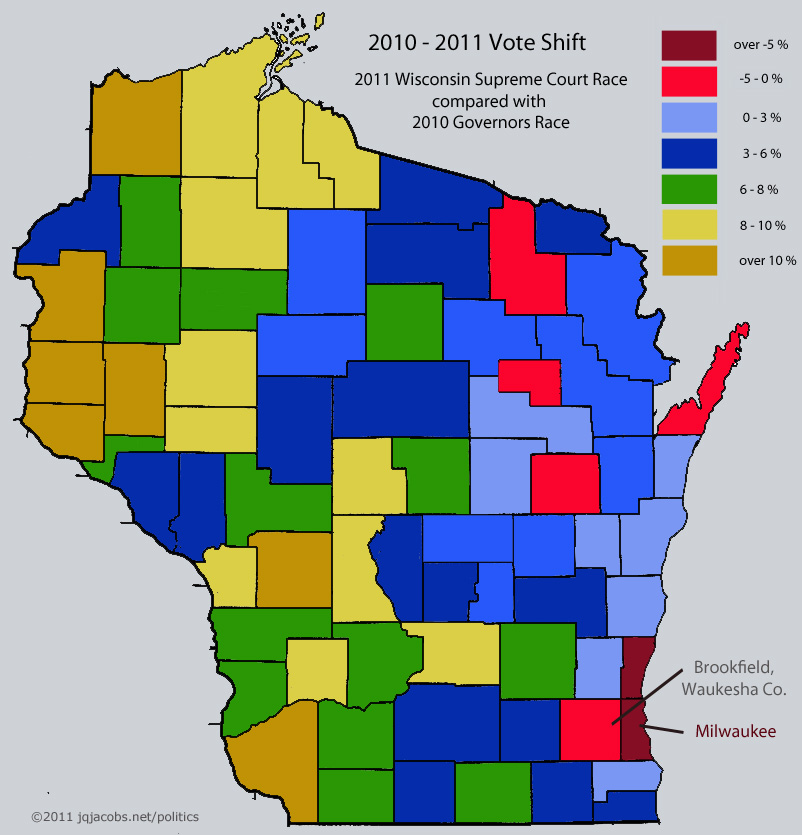
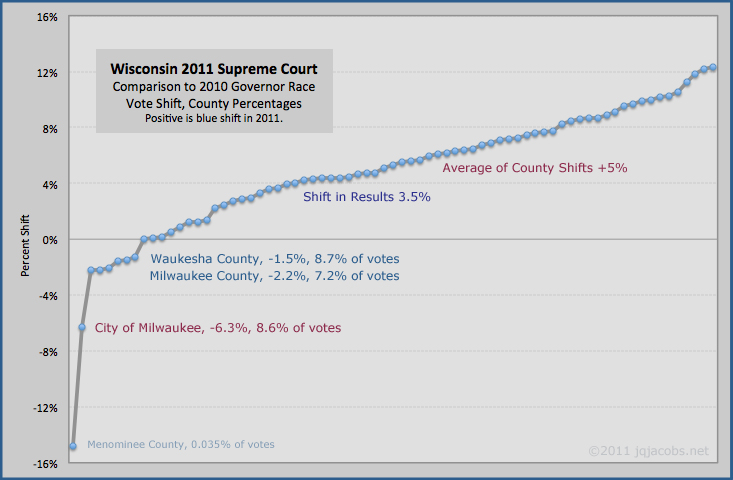
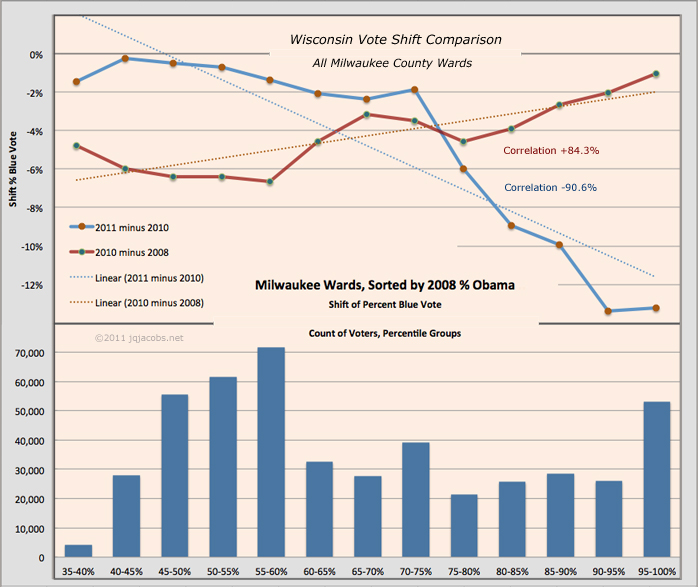
Wisconsin 2011 Supreme
Court:
wisconsin_2011_workbook.xls
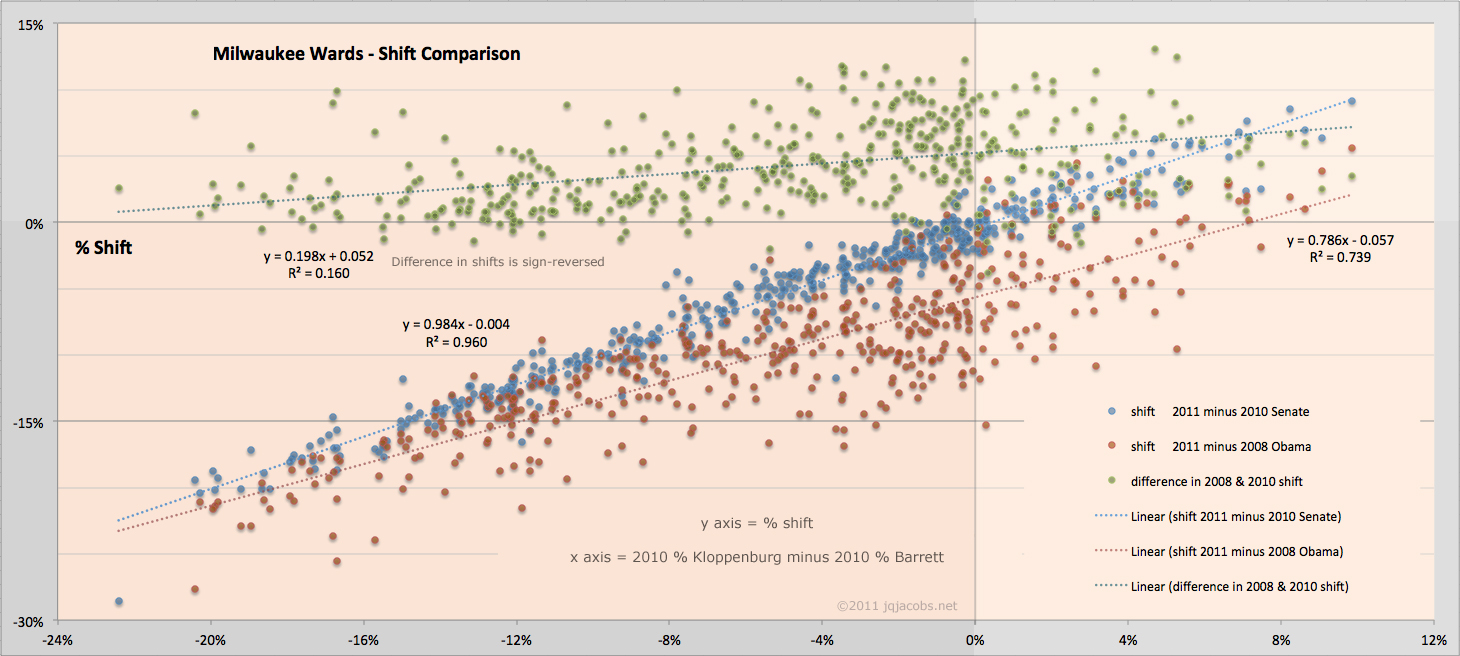
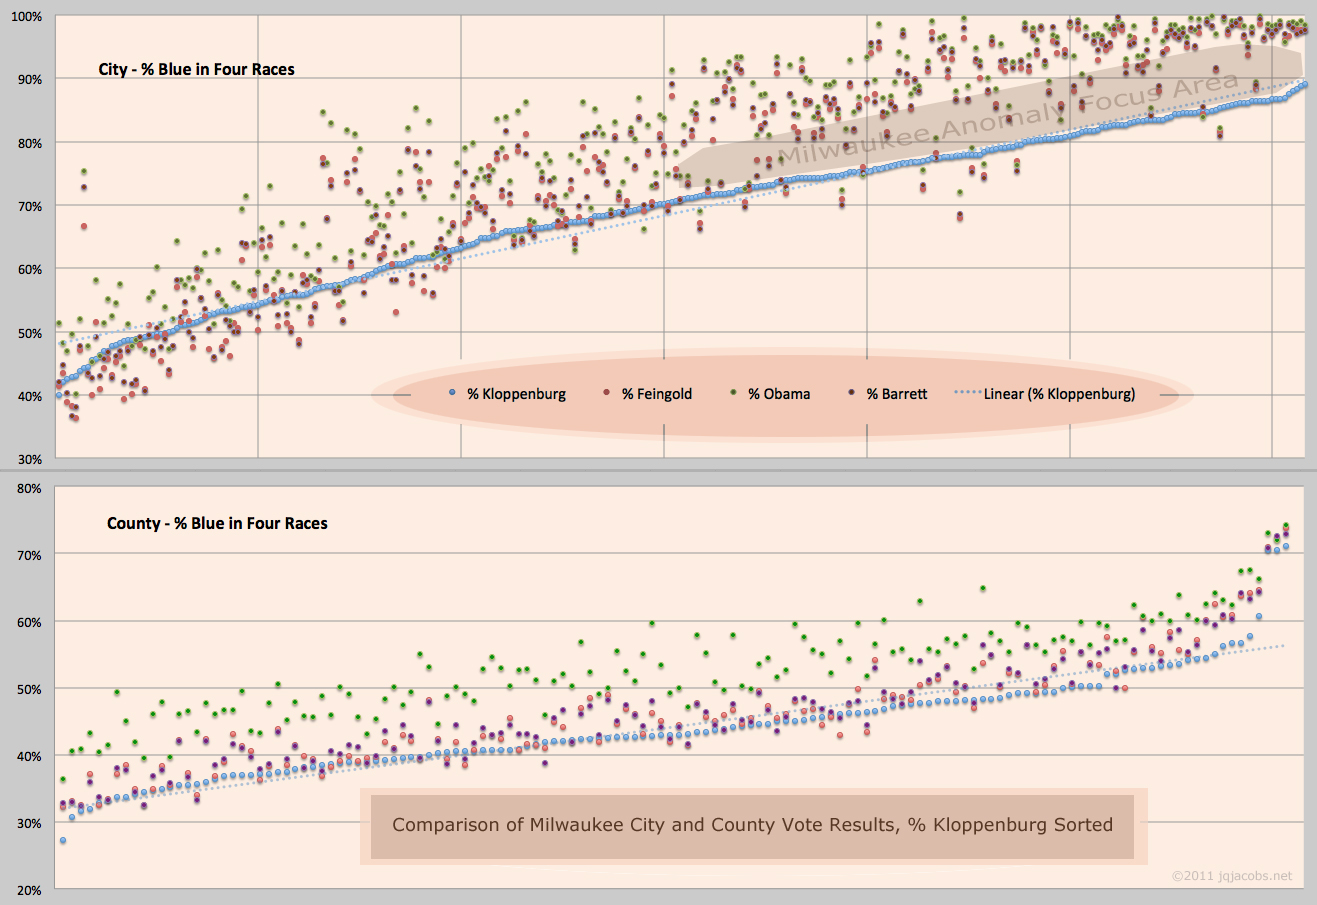
milwaukee_city_scatterplots.xls
Click files below to view full-scale versions.

All the spreadsheets are Excel files.