The
2004 Ohio Presidential Election: Cuyahoga County Analysis
How Kerry Votes Were Switched To Bush Votes
© 2008 by James Q. Jacobs.
All Rights Reserved.
and anomalies in Ohio. In many cases these irregularities were caused by intentional misconduct and illegal behavior...." Preserving Democracy: What Went Wrong in Ohio Status Report of the House Judiciary Committee Democratic Staff, Jan. 2005. |
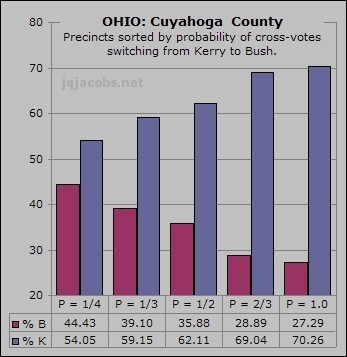
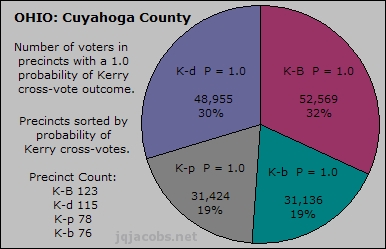
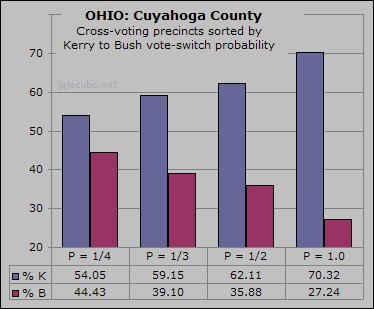
In a
subset of 166,953 votes, one of every 34 Ohio voters, the Kerry-Bush margin
shifts six percent when the population is sorted by outcomes of wrong-precinct voting.
Preface
Simply put, Ohio votes were NOT all counted as cast. Many votes were miscounted, and Kerry votes were counted for Bush. Numerous questions have been raised about the fairness of the 2004 Presidential election in the United States of America (US). In this study I focus on one election issue, punch card cross-voting—how votes cast one way were counted other than as intended, as a vote for a different candidate or option. Punch card voting has been replaced and, with so many election issues, this most egregious of flaws—counting votes wrong—has seemingly been overshadowed by e-voting and reform concerns. I also focus on a particular region with one-tenth of the Ohio vote, Cuyahoga County, where recount crimes have detracted from miscounting the vote. The 2004 recount issue focused attention away from cross-voting. Cross-votes recount the same and, hence, are an entirely distinct issue.
In 2000, the US post-election focus was on Florida, on fairness of punch card voting, on vote count accuracy, and on incomplete counting. In 2004, Ohio's failure to replace punch card voting with improved systems is just one of many issues raised with regard to the Ohio 2004 Presidential election. Other Ohio fairness, fraud, and irregularity issues include politicization of process, voter registration fraud, voter purging and suppression including racial discrimination and unfair voting machine distribution, the exit poll inaccuracy, electronic voting security, paperless e-voting, e-vote flipping, the high percentage of and unequal distribution of undervotes, uncounted provisional ballots, vote count secrecy, recount crimes and irregularities, and official loss of and/or destruction of evidence.
This article and the appendices combine, with additional material, earlier versions cited in academic references. In a separate file, I present a 2004 Ohio Presidential Election Results Summary and various Ohio datasets.
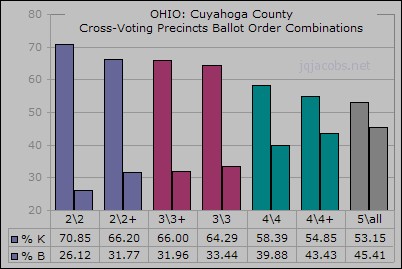
Seven-eights of voters
in heavily-Democratic Cuyahoga County,
more
than one of every eight
Ohio Kerry voters, could have cross-voted at
an adjacent precinct using the wrong ballot order.
![]()
Jump to: Table of Contents | Data Files | Printer
Friendly Word or PDF versions
Download vote_switching.ppt featuring
highlights from the study.

Download ohio_figures.ppt featuring
graphics from the article.
Download precinct_switching.ppt featuring
evidence of election fraud.
| Data
Files, Cuyahoga County Precinct Level Analysis: Excel
Spreadsheets with Probability Sorting and Statistical Analyses
Spreadsheets used in the initial analysis were updated online in July 2006 with cross-vote probability sorting and related charts. Missing data for several precincts was located and inserted and slight errors were corrected. Precincts and locations were resorted, cross-vote probabilities for all precincts and locations were determined, probability subsets were sorted, probability sorts were analyzed and compared, and statistical summaries were added. Significant statistical anomalies are highlighted in the spreadsheets. I consider the data reliable. Let me know if you detect any problem whatsoever. |
The contents links allow readers familiar with some aspects of the issue to focus on specific topics. The subject is complex, and introductory material is conveyed throughout the topics and in the appendices. This topic required defining vocabulary and creating new notations. These are defined throughout the article and discussed in the appendix.
![]()
Miscounted votes in Ohio came to my attention via press coverage. An incident came to light due to very high returns for third-party candidates in several Cuyahoga County precincts:
Cleveland Paper Cites Voter Problems, Votes Assigned to Wrong Candidates AP, 12/11/04, "approximately 1,000 voters in the two precincts cast ballots just steps away at machines meant for the other precinct."
I was astounded to discover that an election could be so flawed in design. I wondered, "Why would two ballot orders be used in one location if votes could be switched?" and then, more importantly, "How many votes were switched, and to whose advantage?"
"How many votes were switched?" should be an easy number to define, I initially surmised. Wrong-precinct voting occurred at a surprisingly high rate. Instead of immediate clear answers, trying to tally the miscounting led down a long path with many more questions, taxed my knowledge of statistics and quantitative methods, necessitated developing new methods, and produced unexpected findings of unfairness in the election process—all providing a political education my political science classes never even considered. The evidence raises suspicions about intentional manipulation of the election process directed at changing the outcome in favor of Bush. I soon wondered, "Were ballots fraudulently switched?"
For Ohio punch card voting, accurate tally is dependent on precinct chain of custody, from giving the voter a ballot until central tabulation. Ballots must be cast and counted in their own precinct. Many votes were counted for the wrong candidate or ballot option, and a significant portion of the cross-voting resulted in Kerry votes tallied as Bush votes. The 2004 Presidential election hinged on the Ohio results. According to unadjusted exit polls, Kerry won Ohio. Instead, with a 3.35 percent difference between the tallies, the results gave the victory and the presidency to Bush. With these circumstances, evidence of miscounted voting and Kerry-to-Bush vote switching have particular importance in determining the actual intent of Ohio voters, the reasons for the exit poll discrepancy, and the validity of the 2004 US Presidential election result. Cross-voting also impacted other races. Analysis of past elections and other counties and races may reveal more punch card cross-voting.
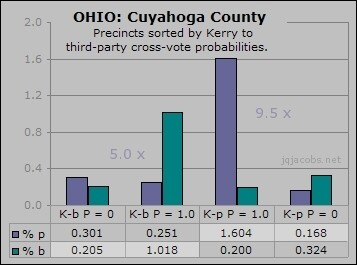
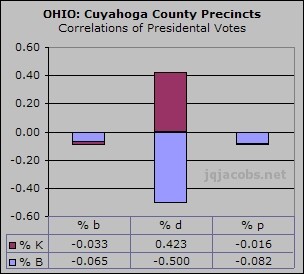
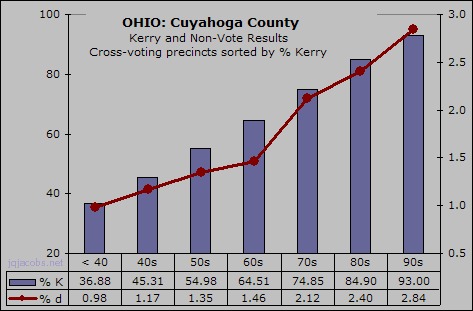
I present evidence of cross-voting and of how Kerry disproportionately lost votes to cross-voting. I report how ballot order combinations favored Kerry to Bush cross-voting. I present methods developed to determine how many votes were switched, miscounted, or not counted at all. I report the impact of cross-voting and present evidence of the degree of miscounted voting. Finally, statistical tests are applied to the data. Analysis of election results—because every respondent has been polled—is, largely, descriptive statistics, enabling robust statistical analysis without some margin of error problems of sample polling used in inferential statistics.


