| 
Candidate Support,
Disqualified, and the Non-Votesl.
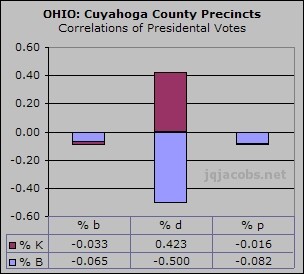
Non-voting was not randomly distributed. The percentage
of non-votes increases with Kerry support. The precinct-level correlation
of non-votes to Kerry votes is 0.423, while to the Bush votes is -0.50
(Figure 1). The higher the Kerry support, the greater the percentage
of votes not counted.
Kerry and other candidate cross-votes can tally as disqualified, and
given random distribution of cross-voting and Cuyahoga County's reported
66% support for Kerry, most cross-votes lost as non-votes would be
Kerry votes. |
Figure 1. |
 |
|
Non-votes also include votes not counted (i.e. hanging
chads) and no vote cast for president. In some states, the non-vote percentage
is well below one percent. Ohio recorded near the highest rate in 2004. The
Ohio electronic vote percentage is near normal, just 0.76%, compared to 1.90%
for punch card votes. In punch card counties, a substantialy higher portion
of the Ohio vote was not counted. Additionally, many cross-votes were counted
opposite the voter's intention.
Table 12 presents the precinct average number of non-votes,
precincts sorted by Kerry support.
| Table 12. Average Number of
Non-Votes per Precinct. |
| % Kerry: |
> 90 |
80-90 |
80-60 |
<60 |
Mean Votes per Precinct |
| # Non-Votes: |
12.1 |
10.0 |
7.7 |
5.9 |
420 |
Figure 2 illustrates the rate of non-votes for the 2\2 precincts
sorted by the level of Kerry support. At 2\2 locations, when Kerry cross-votes
switch to Bush in one precinct they switch to disqualified from the other
precinct. Assuming random, equal cross-voting in both directions, the non-vote
percentage is a useful and direct indicator of Kerry-Bush vote-switching.
The non-vote rate is highest for precincts with a preponderance of Kerry
support, that is, where cross-voting reduces the Kerry vote the most and
vote-switching most heavily favors Bush.
Figure 2. |
 |
It appears Kerry was robbed of votes!
Figure 3 shows the Cuyahoga precincts with greater than one standard deviation
(z-score > 1) from the mean non-vote percentage, 1.80% in Cuyahoga County.
Z-score is the number of standard deviations from the mean. These are the
Cuyahoga precincts with over 3.6% non-votes, including those with only one
ballot order. This sort represents 11.0% of the ballots cast and 27.7% of
the non-votes.
Figure 3. |
 |
Nearly all of these are precincts with over 75% Kerry support, most have
over 90% Kerry support!
The 11.0% of Cuyahoga precincts with over 3.6% non-votes have 27.7% of the non-votes
and a mean of 10.25% Bush voting, so only
one of ten uncounted votes are probable Bush votes. The precincts with
greater than 1.5 stdev have a median of 94% Kerry support (Figure 4). With
non-votes, what really matters is, "How
many of who's votes are uncounted." Where votes go uncounted is more
significant than how many. In Cuyahoga County,
Kerry lost a very high, non-random proportion of the uncounted votes. This
concentration of cross-voting/undercounting where it impacts results the
most raises suspicion of irregularities and presents
yet another mystery, "Why is
undervoting concentrated in locations with the highest Kerry support?"
In Ohio, Bush's reported margin is greater than the non-vote total. If the uncounted vote in New Mexico, the nation's highest at 2.42%, was
this one-sided (over 75% uncounted Kerry voters), Kerry won in NM. Officially,
Bush won NM by 6,000 votes with 18,000 non-votes. Under random circumstances,
when candidates lose votes proportional to the results, non-voting does not
change the outcome. The Kerry to non-vote correlation for 33 NM counties
is 0.454, the Cuyahoga County correlation for 1432 precincts is 0.423.
If the Ohio e-vote non-vote percentage is applied to Cuyahoga County precincts,
and if the excess non-votes over that percentage are counted according to
the reported precinct voting, the added votes would tally 4,833 Kerry and
1,284 Bush. The 11.0% of Cuyahoga precincts with over 3.6% non-votes have
27.7% of the non-votes. Kerry's support county wide is 65.66% while 79.01%
of excess non-votes are untallied Kerry supporters. The Bush vote was reported
to be 32.00% while only 20.99% of the untallied are Bush supporters. In NM,
this proportion, 79% Kerry to 21% Bush, would give Kerry the victory. Simply
put, "While Cuyahoga reported 2/3 Kerry voters, 4/5 of excess non-votes are
Kerry supporters." Why is undercounting focused in Kerry areas? In Cuyahoga,
part of the non-vote is cross-voting.
Figure 4. |
 |
The big difference between Ohio and NM seems to be
which
minority is being robbed of votes.
Undervotes.
I wrote, "If New Mexico had Nevada 's undervote rate and 3/4 of the remaining
undervotes are uncounted Kerry votes, Kerry wins New Mexico ." This comparison
can be made using, instead, the NM counties with normal undervotes. All the
counties below the 1% line on the graph below average, at 0.45%, even lower
than Nevada 's county average. Such a comparison also emphasizes the unfair
NM machine bias (or whatever this was). I just studied this further, updating
the NM spreadsheet in the process. Here is a new statistical summary of the
vote counting disparities in NM, comparing the two very obvious NM groups:
In 12 NM Bush counties
(15% of votes)
non-voting is below 0.78%, averaging 0.45%. |
In 21 NM counties (85% of votes) non-voting
ranges from 2.03% to 8.4%, at 2.76% of voters. |

In the low undervote group of 12 counties, Bush has 19%
higher support, and all 12 of the normal undervote counties reported favoring
Bush.
The Kerry support correlation to undervoting is equally explicit in Cuyahoga
County. The % Kerry to % non-vote correlation for 33 NM counties is 0.454,
the Cuyahoga County correlation for 1432 precincts is 0.423. Bush's vote has
a -0.562 correlation to non-vote percentages for NM counties, -0.500% in Cuyahoga
precincts. The big difference between Ohio and NM seems to be which minority
is being robbed of votes.
If the Ohio e-vote counties' percentage of non-votes is applied to Cuyahoga
County precincts, and if the excess non-votes over that percentage are counted
according to the reported precinct voting, the added votes would tally 4,833
Kerry and 1,284 Bush. The 11.0% of Cuyahoga precincts with over 3.6% non-votes
have 27.7% of the non-votes and a mean of 10.25% Bush voting. Kerry's support
county wide is 65.66% while 79.01% of excess non-votes are undertallied Kerry
supporters. The Bush vote was reported to be 32.00% while only 20.99% of the
undertallied are Bush supporters. In NM, this proportion, 79% Kerry to 21%
Bush, would give Kerry the victory. Simply put, "While Cuyahoga reported 2/3
Kerry voters, 4/5 of excess non-votes are probable Kerry supporters."
Why is undervoting focused in Kerry areas? In Cuyahoga, part of the non-vote
is punch card cross-voting. In NM, punch cards cannot be blamed and the correlation
to voting machines is far beyond credibly coincidence. The NM officials
who failed to properly respond to a grossly unfair election have yet to justify
their inaction. |